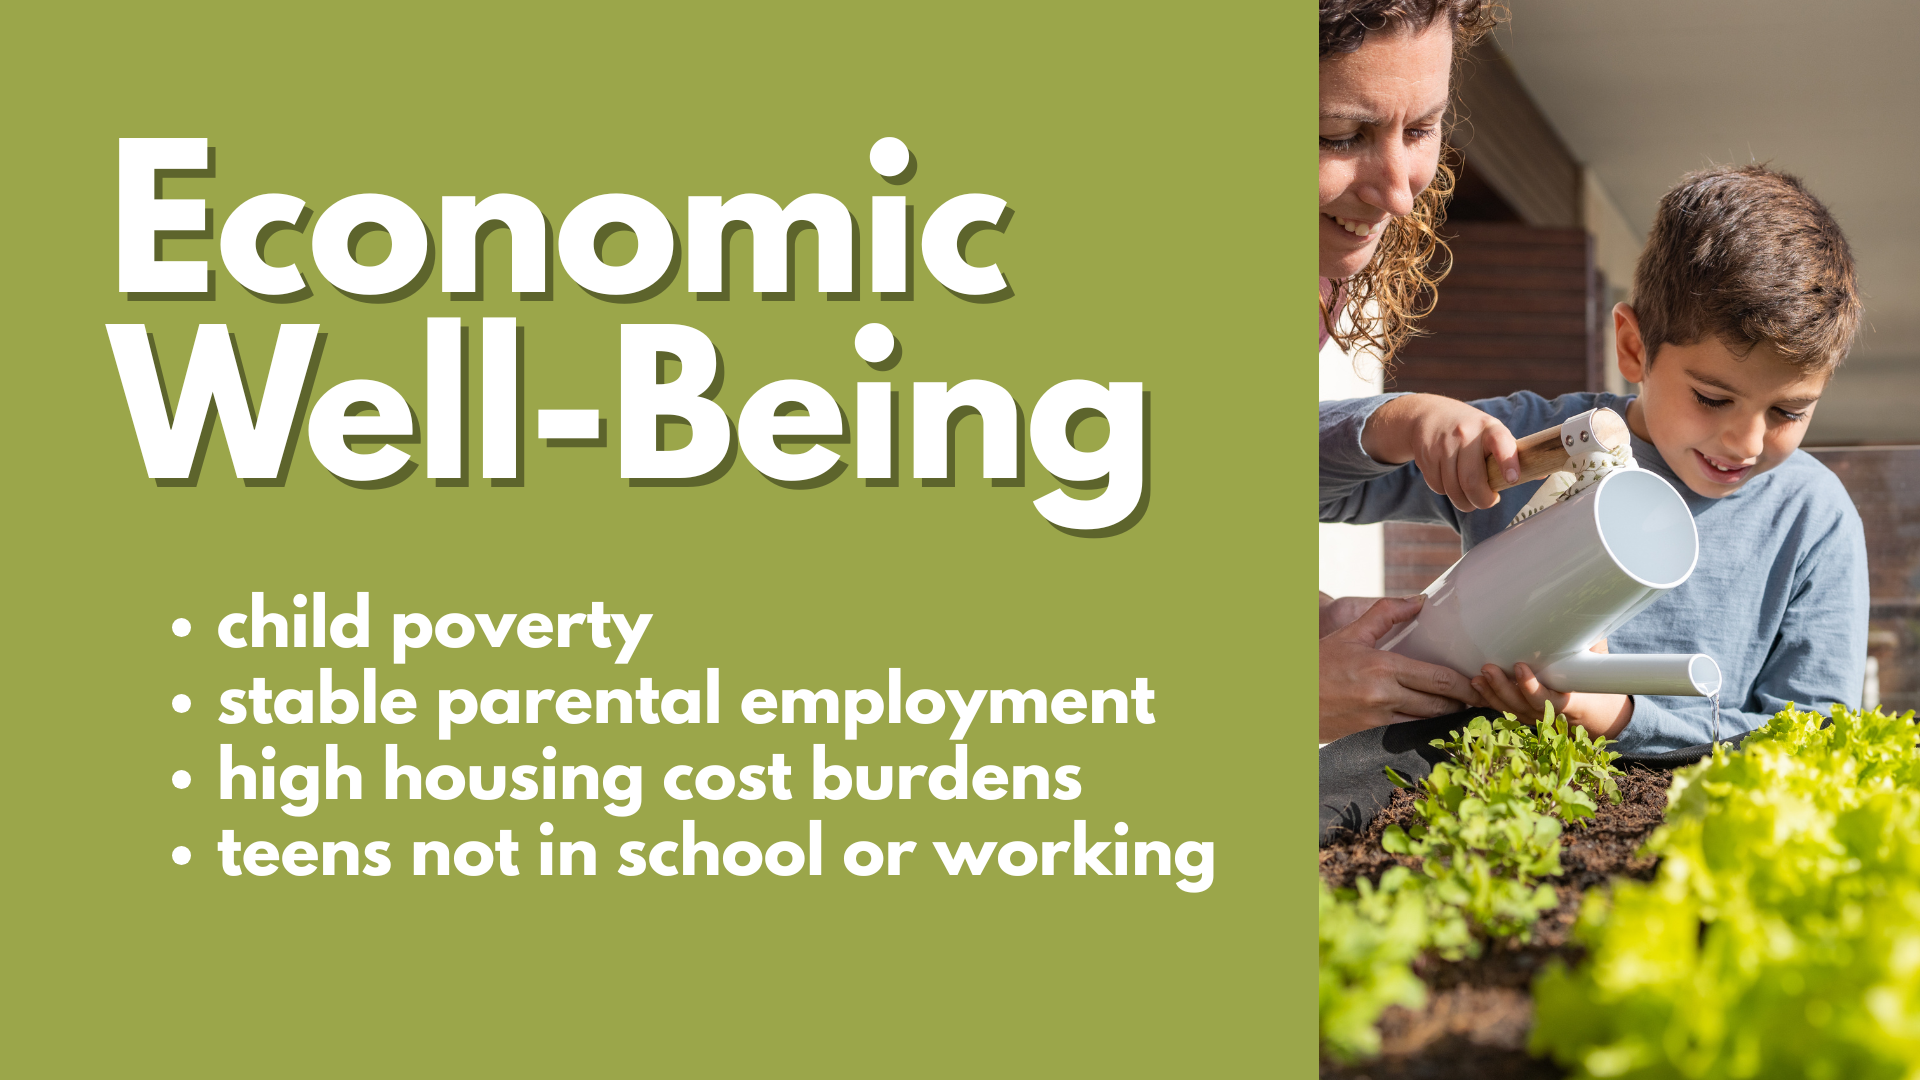
This web page is a concept developed by Chris Lysy of freshspectrum.com for educational purposes.  You can see how the post was created, and all of the original materials by following this link.

KIDS COUNT 2025

An alternative interactive data dashboard.

Every year, the Annie E. Casey Foundation ranks all 50 states on how well children are doing. The 2025 KIDS COUNT Data Book looks at 16 measures across four areas of life: economic well-being, education, health, and family and community. States are ranked from 1 (best) to 50 (worst) based on how they score across all four areas combined.

Where a child grows up matters. States at the top of the rankings tend to be in the Northeast and Midwest. States at the bottom tend to be in the South. But no state is doing well on everything, and no state is doing poorly on everything. The rankings show where kids are struggling most — and where there is room to do better.

Behind the Rankings

The chart below will show you the rankings for all fifty states.   

The first number in each chart is the rank for overall well-being, this ranking is based on all 16 measures.  Lower rankings represent better performance on the underlying measures.

The next four numbers shown are rankings for each domain.  Each domain rank is based on just four measures.  A state ranked 25th overall could be doing well in health and struggling in education, or the reverse. 

The only way to understand what is actually driving a state’s ranking is to look at the indicators behind it. Use the links below the chart to explore each of the four domains — economic well-being, education, health, and family and community — and see where your state’s strengths and challenges really are.

Domains & Individual Measures

Economic Well-Being

Indicators: child poverty; stable parental employment; high housing cost burdens; teens not in school or working

Education [Section Not Available]

Indicators: young children not in school; fourth grade reading; eighth grade math; high school graduation

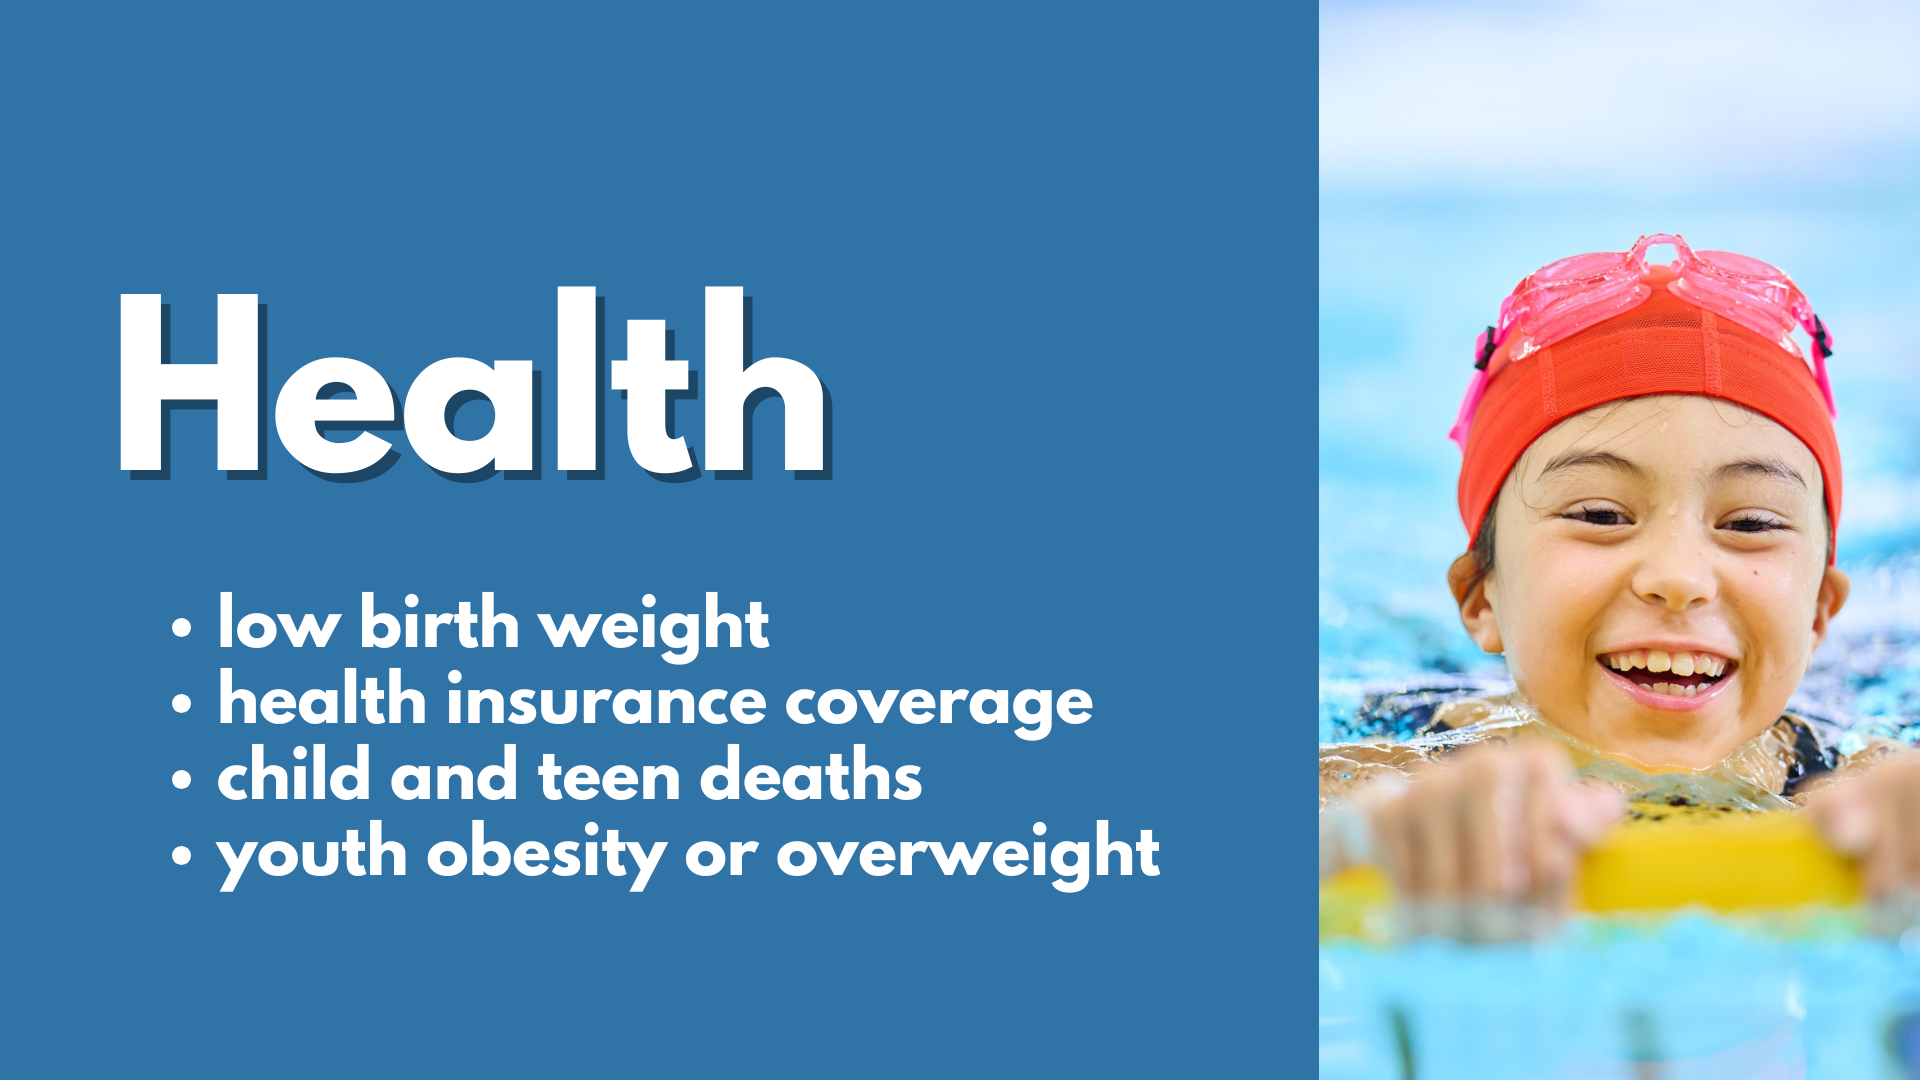
Health [Section Not Available]

Indicators: low birth weight; health insurance coverage; child and teen deaths; youth obesity or overweight

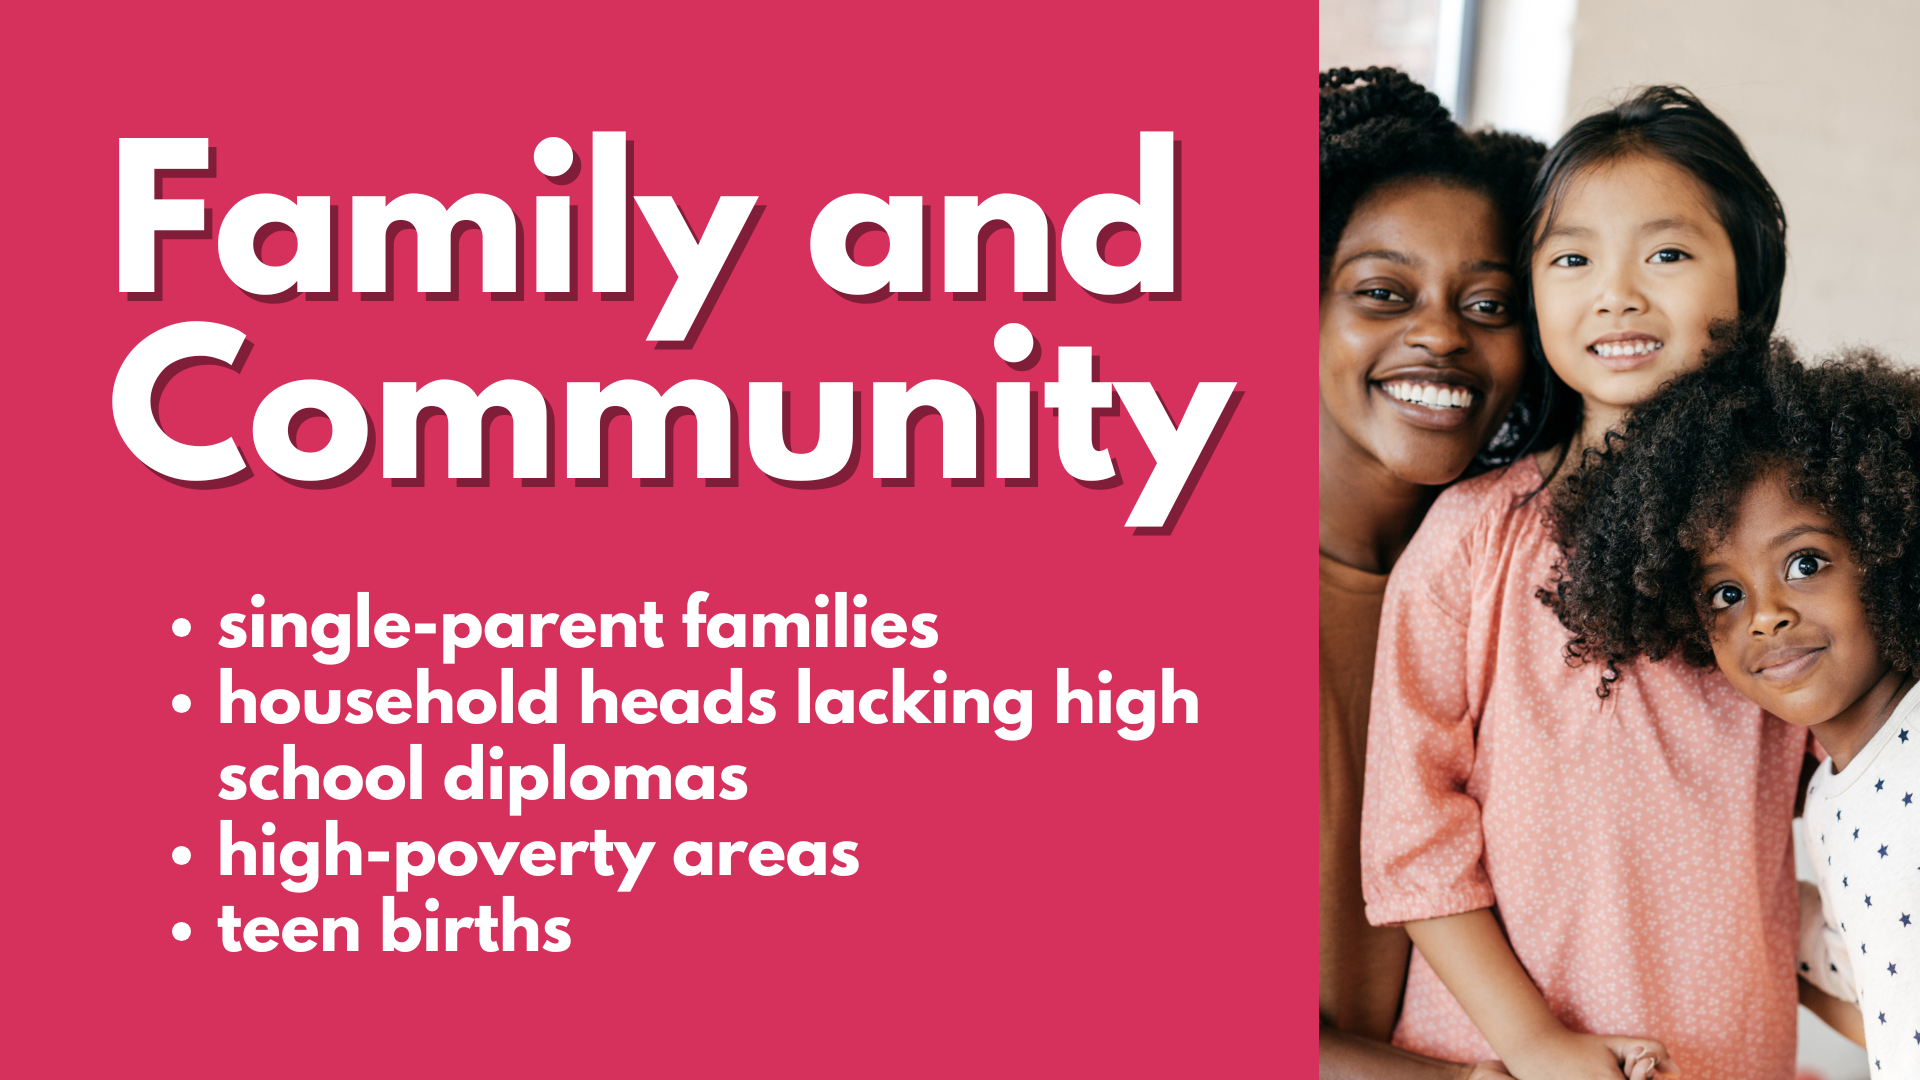
Family and Community [Section Not Available]

Indicators: single-parent families; household heads lacking high school diplomas; high-poverty areas; teen births

This dashboard was developed by Chris Lysy at freshspectrum.com as part of the Before and After series — adapting publicly available research to make it more accessible. It is an attempt to recreate the 2025 interactive data book, using the interactive format to share additional data.